Arthas简介
一、简介
1、概述
Arthas是Java程序的诊断工具,可以对运行中的Java应用进行无侵入式诊断分析,它支持热加载类、实时线程监控、诊断方法调用、分析内存占用等多种功能,能够帮助开发者快速定位问题和排查故障。
2、核心功能
- 定位线程问题
分析CPU占用过高、线程卡死、死锁、频繁BLOCKED等问题,可以使用thread命令。
例如:thread -n 3输出最耗CPU的3条线程及堆栈;thread -b显示死锁线程。
- 定位方法问题
分析某个方法的耗时情况,以及被谁调用、入参/返回值是什么等,可以使用trace命令。
例如:trace com.xxx.PayService doPay显示PayService.doPay()方法的调用及耗时情况。
- 定位内存与GC问题
无需jmap dump命令生成dump文件,就能知道谁占用内存最大、谁创建对象最多;可以使用dashboard命令查看:堆、线程数、GC次数等实时面板。
- 热更新与反编译
可以反编译任何一个类,并在内存里编译替换原来的类,可以使用jad、mc和redefine命令。
例如:使用jad命令反编译Config类:
jad --source-only com.xxx.Config > /tmp/Config.java
修改Config.java类后,使用mc命令直接在服务端内存里编译:
mc /tmp/Config.java -d /tmp
使用redefine命令完成热更新:
redefine /tmp/com/xxx/Config.class
- 性能采样与火焰图
使用profiler命令生成火焰图,分析CPU占用率升高原因。
profiler start -e cpu
...等待30s...
profiler stop --format flamegraph
二、安装与运行
- 安装
在官网下载Arthas并解压。
- 运行
在解压后的目录中运行以下命令:
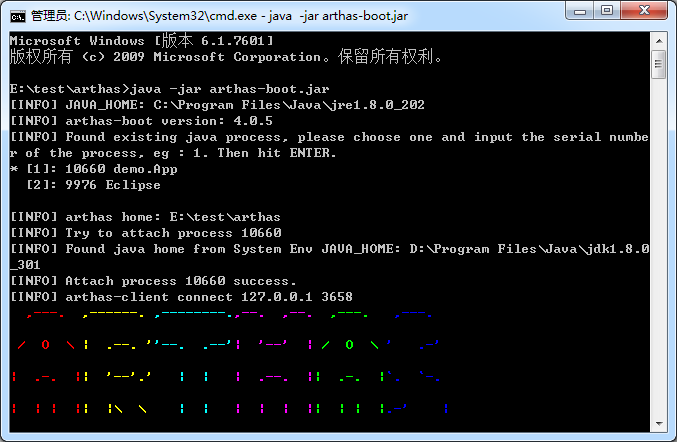
java -jar arthas-boot.jar
三、常用命令
1、JVM监控相关命令
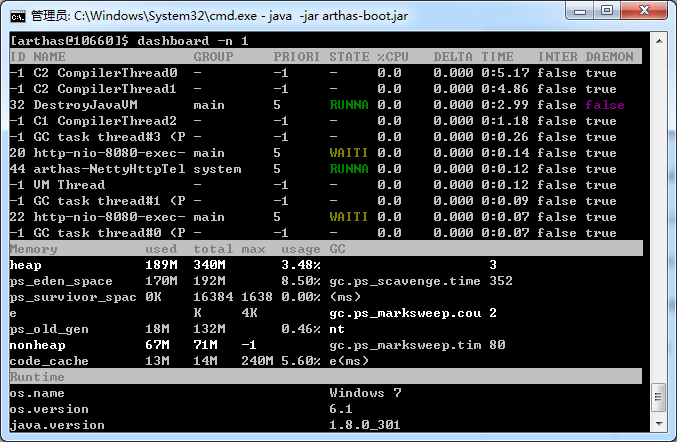
- dashboard
查看系统的实时数据面板,包括CPU使用率、线程状态、内存使用情况等关键信息;如果线程CPU使用率大于50%就需要关注。
#3s 刷新一次
dashboard -i 3000

#刷新5次后停止
dashboard -n 5
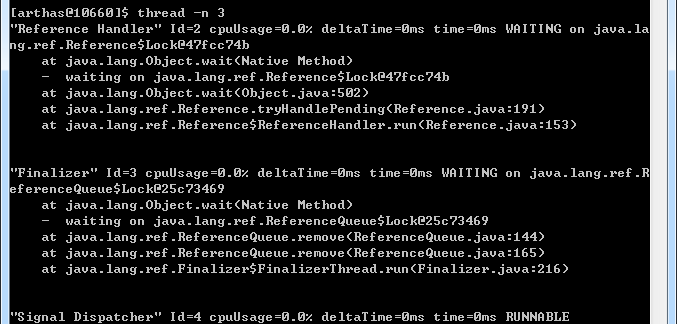
- thread
查看当前JVM线程堆栈信息。
#5s采样期内最耗CPU的3条线程
thread -n 3 -i 5000

#列出阻塞线程
thread --state BLOCKED
- gc
查看GC的相关信息,包括GC次数、消耗的时间等,便于监控垃圾回收情况。
#最近10次的GC记录
gc -n 10
2、类与字节码相关命令
- sc
Search Class:列出已加载的类信息,可以查找特定类的加载信息,包括类的详细信息、类加载器等;
#-d打印字段/方法,-f打印常量池
sc -d -f java.lang.String

#用classloader hash精确定位同名类
sc -d *StringUtils
sc -c 2a139a55 *StringUtils #2a139a55为上一步结果中classloader的哈希码
- jad
反编译已加载类的源码。
#查看String类的源码
jad java.lang.String

#反编译并保存源码
jad --source-only com.xxx.MyUtil > /tmp/MyUtil.java

#查看指定方法源码
jad --source-only com.xxx.MyUtil myMethod
--source-only仅显示源码,不显示其他元数据。
- redefine/retransform
动态加载外部.class文件,修改类定义,实现代码的热更新。
#覆盖原字节码,新的类结构不能改变(字段、方法签名都不能增删)
redefine /tmp/MyUtil.class

#可以增删字段/方法,但必须借助Java-agent提前注册ClassFileTransformer
retransform /tmp/MyUtil.class
3、方法观测相关命令
- watch
观测方法执行时的入参、返回值和抛出异常等。
#查看DemoController类中test方法的参数
watch com.demo.controller.DemoController test '-params'

#查看DemoController类中test方法的返回值
watch com.demo.controller.DemoController test 'returnObj'
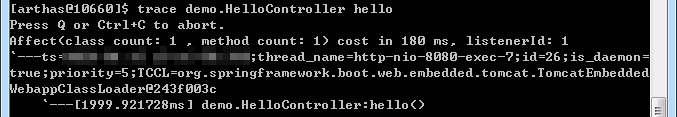
- trace
追踪方法内部调用路径及其耗时。
#追踪DemoController类中test方法的调用路径及耗时
trace com.demo.controller.DemoController test

#同时追踪两个类的全部方法
trace -E com.xxx.A|com.xxx.B *
- monitor
对方法执行情况进行监控,默认间隔1秒输出一次监控数据。
#查看该方法每秒的调用次数、执行总时长、平均时长
monitor com.demo.controller.DemoController test

#修改默认间隔为5秒
monitor -c 5 com.xxx.OrderService pay
- tt
记录下指定方法每次调用的入参和返回信息,并能对这些不同时间下的调用进行观测。
#只记录一次该方法的调用情况
tt -n 1 com.demo.controller.DemoController test

#输出方法调用路径上的每个节点的耗时
tt --trace com.demo.controller.DemoController test
4、其他命令
- profiler
生成火焰图进行性能分析;使用profiler start启动profiler,默认生成cpu的火焰图;使用profiler stop停止profiler并生成火焰图结果。
- dump
将已加载类的字节码dump到磁盘。
#把String.class字节码保存到磁盘
dump -d /tmp/dump java.lang.String
- options
查看或设置Arthas全局配置。
四、案例
1、代码
- pom.xml
<parent>
	<groupId>org.springframework.boot</groupId>
	<artifactId>spring-boot-starter-parent</artifactId>
	<version>2.7.18</version>
	<relativePath />
</parent>

<dependencies>
	<dependency>
		<groupId>org.springframework.boot</groupId>
		<artifactId>spring-boot-starter-web</artifactId>
	</dependency>
</dependencies>
- Controller
import org.springframework.web.bind.annotation.GetMapping;
import org.springframework.web.bind.annotation.RestController;

@RestController
public class HelloController {

	@GetMapping("/hello")
	public String hello(String name) {
		try {
			Thread.sleep(600000);
		} catch (InterruptedException e) {
			e.printStackTrace();
		}
        return "hello " + name;
	}
}
- 主程序
import org.springframework.boot.SpringApplication;
import org.springframework.boot.autoconfigure.SpringBootApplication;

@SpringBootApplication
public class App {

	public static void main(String[] args) {
		SpringApplication.run(App.class, args);
	}
}
2、Arthas
启动案例服务和arthas,选择进程:
- dashboard
查看整体面板:
- thread
查看线程:
- trace
查看方法耗时:
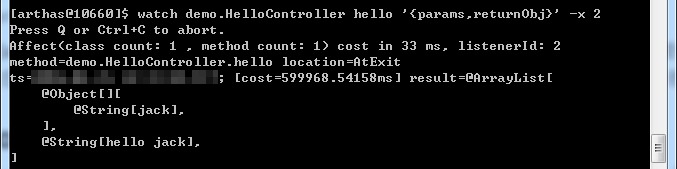
- watch
查看方法入参和返回值:
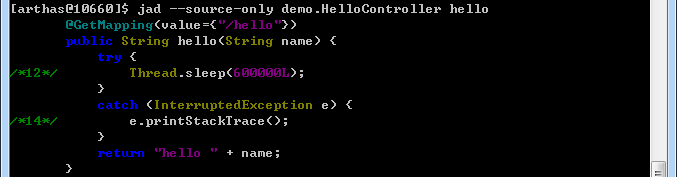
- jad
查看方法代码:
- 热更新
反编译HelloController类,删除线程sleep的代码并更新:
jad --source-only demo.HelloController > D:/tmp/HelloController.java
反编译后的代码删除线程sleep的代码:
       /*
        * Decompiled with CFR.
        */
       package demo;

       import org.springframework.web.bind.annotation.GetMapping;
       import org.springframework.web.bind.annotation.RestController;

       @RestController
       public class HelloController {
           @GetMapping(value={"/hello"})
           public String hello(String name) {
               return "hello " + name;
           }
       }
编译:
mc D:/tmp/HelloController.java -d D:/tmp
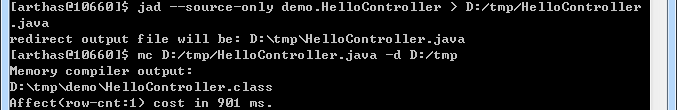
热更新:
redefine D:/tmp/demo/HelloController.class

再次访问http://localhost:8080/hello?name=jack会立即看到响应hello jack。